After completing this lesson, you'll be able to:
In this lesson, you will:
After completing this lesson, you'll be able to:
In this lesson, you will:
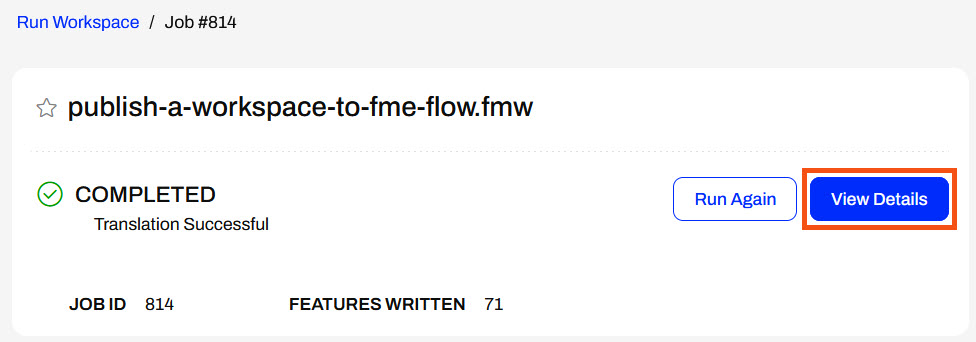
After running a workspace on FME Flow, you can see the translation status from the Run Workspace page. You may also click on View Details to open Jobs and view more information about the job.
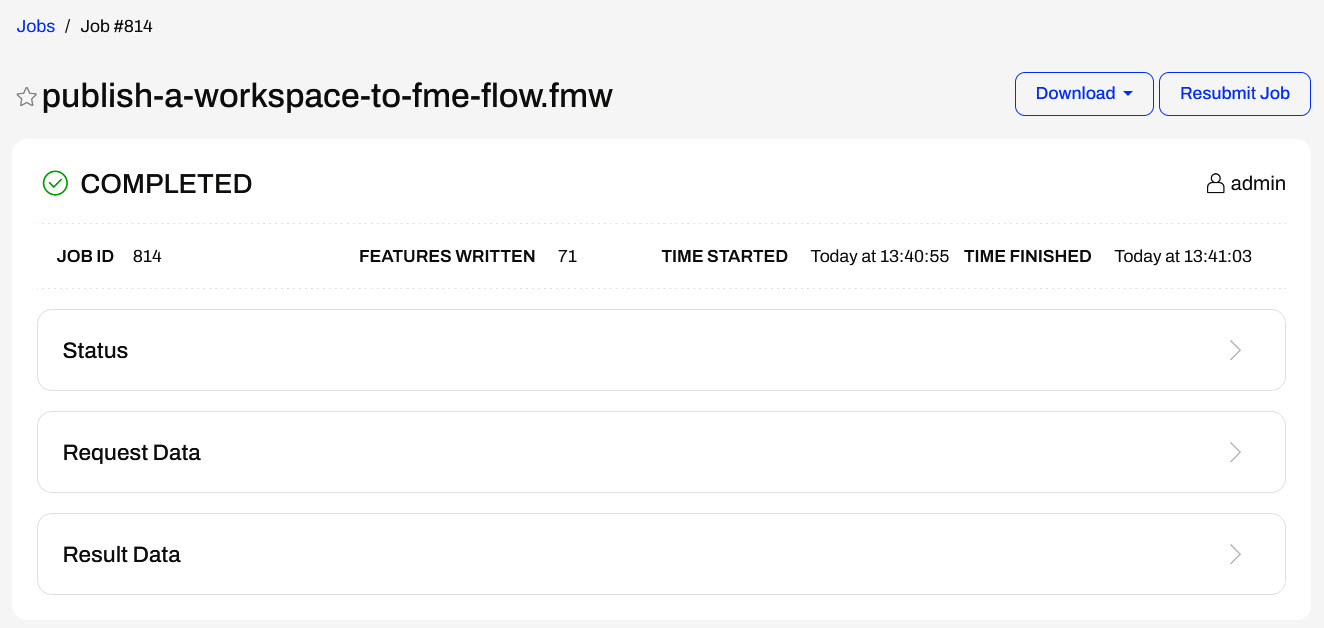
The detailed Jobs page provides more information about the translation and includes expandable sections with even more details. The Status section contains simple statistics about the job. Request Data includes information that the FME Flow Core passes to the FME Engines to carry out the job request, while Result Data is information about the translation result the Engine passes back to the FME Flow Core.
The next section of the page shows the job log. For a completed translation, you see the same information in a job log on FME Flow as in the translation log in FME Workbench. Each job log provides information about the job itself, data processing and transformations, and summaries on features read and written.
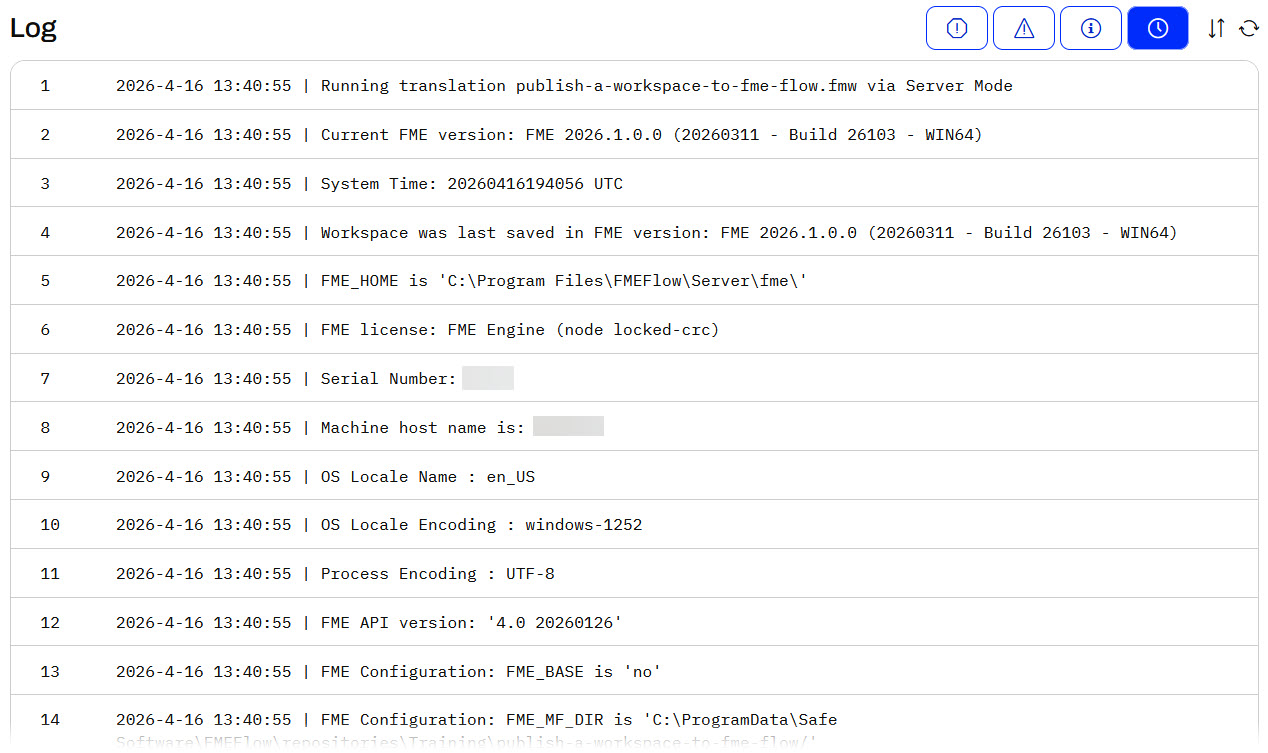
The buttons at the top-right allow you to filter job logs by errors, warnings, and informative messages.
If you're no longer on the completed Run Workspace page and wish to view job details, you can view all recent jobs from the Jobs page. If you click a job, the same detailed view opens as on the completed Run Workspace page from View Details.
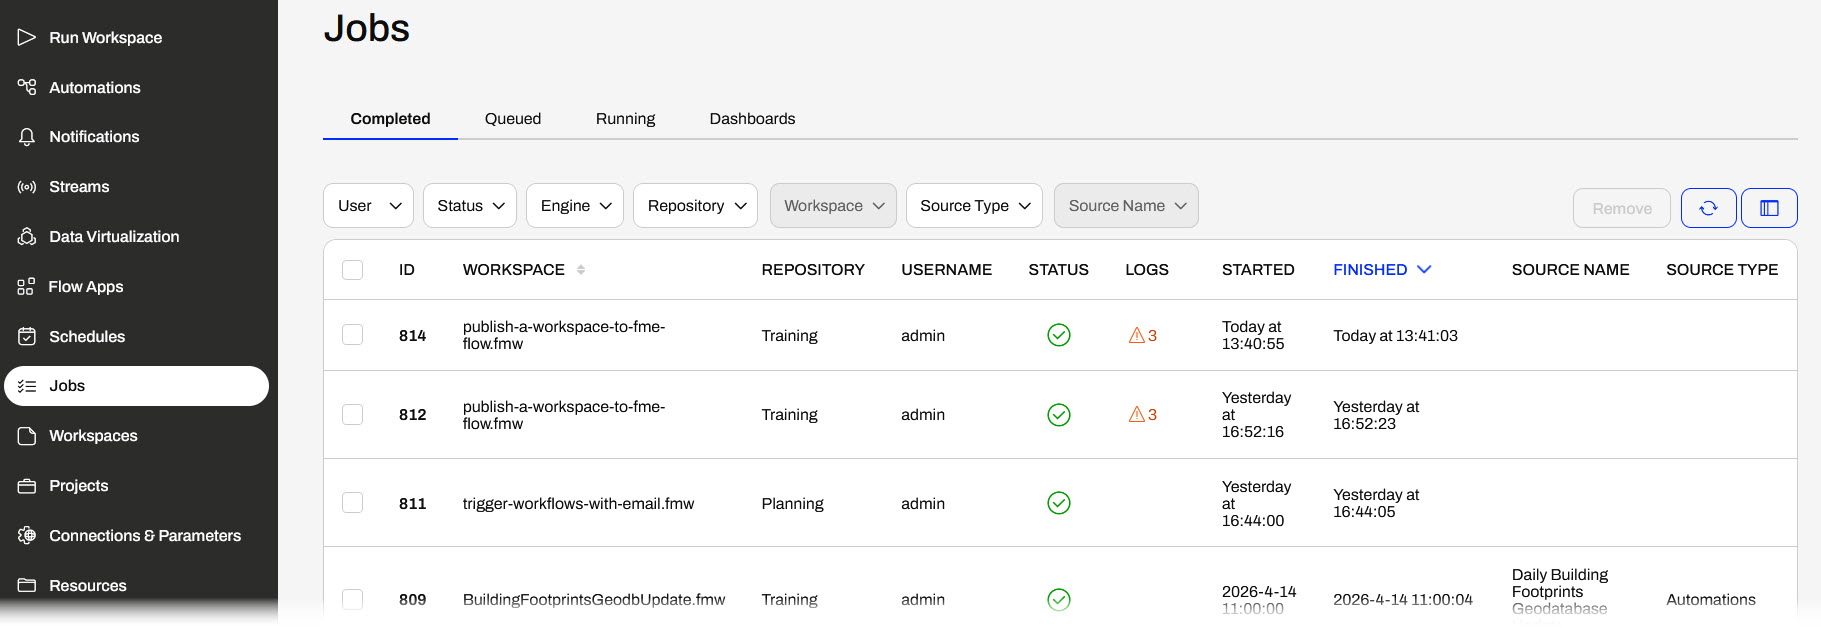
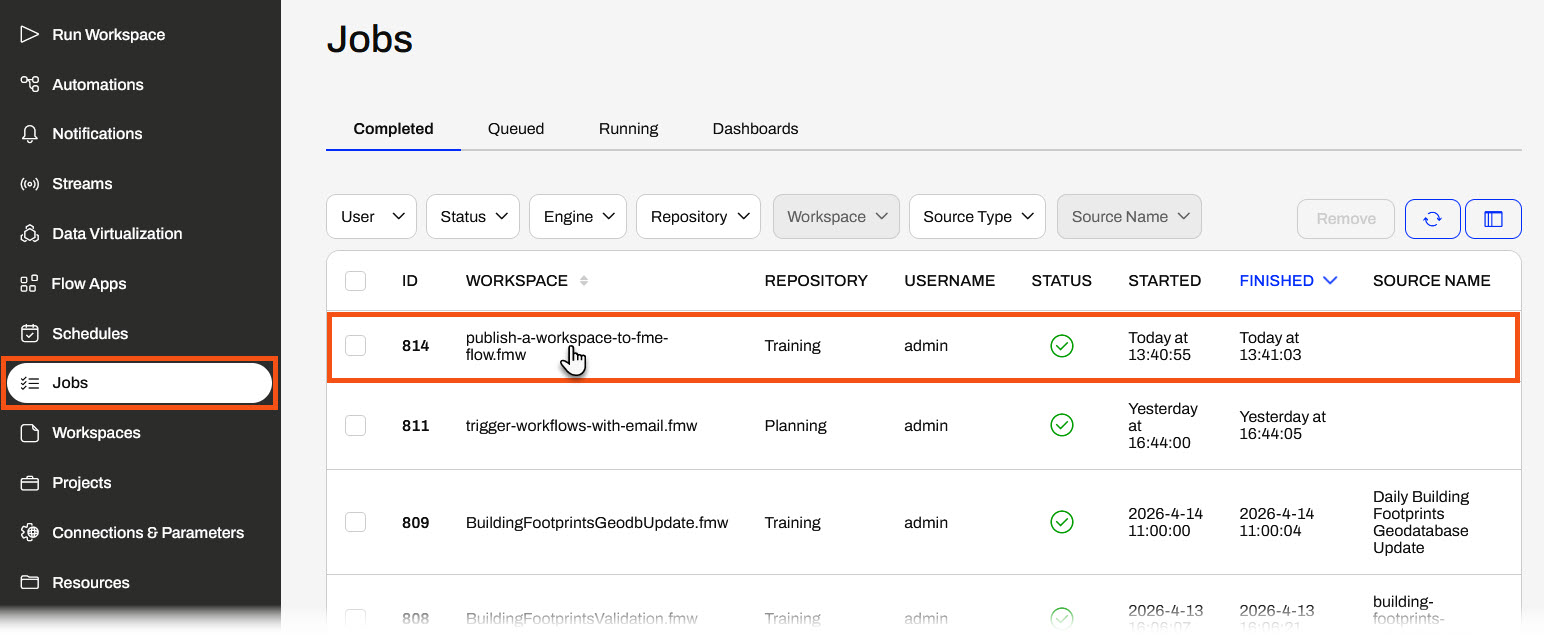
The Jobs page shows information about each workspace translation, including the job ID, workspace name, user who ran it, and job source (e.g., Automations or Flow Apps). The Customize Columns button on the right side allows you to select and change which data fields display in the Jobs view.
You may also filter jobs by various criteria to find specific job information by setting different fields across the top.

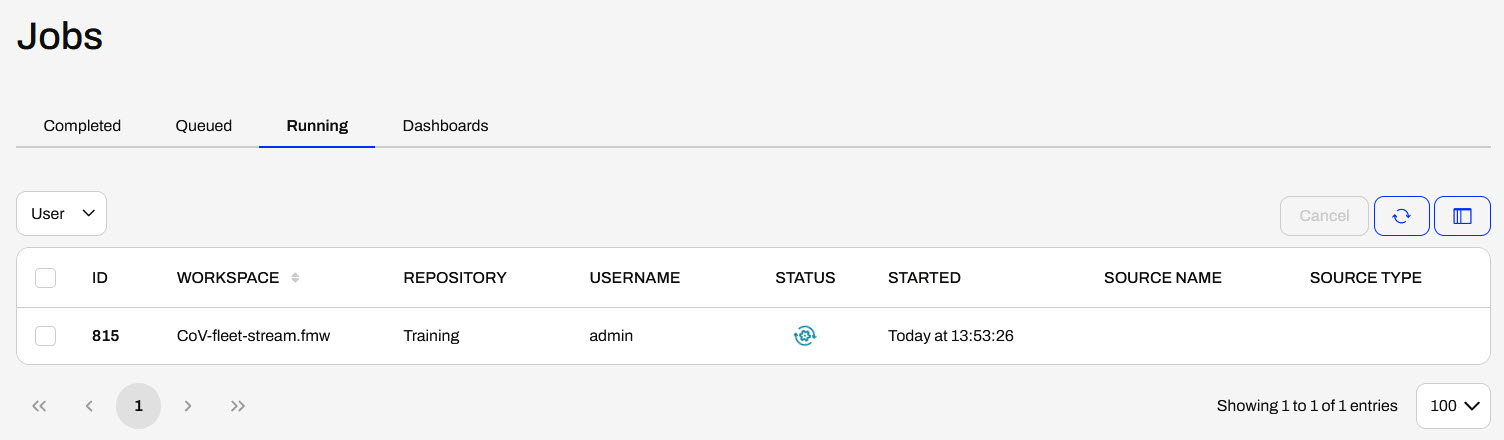
At the top of the jobs page, there are tabs to navigate to jobs in the Queued or Running states and to the Dashboards. Once a job enters the queue, it waits for an available engine to process the translation. The Running section shows jobs that an engine is currently processing. Once the job completes, it moves to the Completed tab.
Dashboards allow you to access a variety of statistical reports about job and engine performance on FME Flow. For more information on setting up and using them, see our Dashboards documentation.

In the last exercise, you helped Sven run his workspace on FME Flow and saw that it completed successfully. Although the workspace ran successfully, you should know where to access more detailed job information for monitoring, development, and troubleshooting.
For this exercise, follow along with the steps below to view the job log for the job you ran in the previous exercise.
In FME Flow, open Jobs on the left side menu to open completed jobs. Click on the publish-a-workspace-to-fme-flow.fmw job to open the job information.
If you are still on the Run Workspace page, you can click View Details to open the job information alternatively to navigating through the Jobs page.
FME Flow ran the job successfully; however, if it failed, this would be the best place to look for information about what went wrong.
Navigate this page to find information about the job. Expand the Status, Request Data, and Result Data tabs and inspect the job log to answer the following questions:
Remember the answers to these questions - you'll need some of them to complete the quiz!
You've now run a job and inspected it on FME Flow. The job log will be the first place you go to find information and errors about any workspace translations on FME Flow.
After running a workspace on FME Flow, you can see the translation status from the Run Workspace page. You may also click on View Details to open Jobs and view more information about the job.
The detailed Jobs page provides more information about the translation and includes expandable sections with even more details. The Status section contains simple statistics about the job. Request Data includes information that the FME Flow Core passes to the FME Engines to carry out the job request, while Result Data is information about the translation result the Engine passes back to the FME Flow Core.
The next section of the page shows the job log. For a completed translation, you see the same information in a job log on FME Flow as in the translation log in FME Workbench. Each job log provides information about the job itself, data processing and transformations, and summaries on features read and written.
The buttons at the top-right allow you to filter job logs by errors, warnings, and informative messages.
If you're no longer on the completed Run Workspace page and wish to view job details, you can view all recent jobs from the Jobs page. If you click a job, the same detailed view opens as on the completed Run Workspace page from View Details.
The Jobs page shows information about each workspace translation, including the job ID, workspace name, user who ran it, and job source (e.g., Automations or Flow Apps). The Customize Columns button on the right side allows you to select and change which data fields display in the Jobs view.
You may also filter jobs by various criteria to find specific job information by setting different fields across the top.
At the top of the jobs page, there are tabs to navigate to jobs in the Queued or Running states and to the Dashboards. Once a job enters the queue, it waits for an available engine to process the translation. The Running section shows jobs that an engine is currently processing. Once the job completes, it moves to the Completed tab.
Dashboards allow you to access a variety of statistical reports about job and engine performance on FME Flow. For more information on setting up and using them, see our Dashboards documentation.
In the last exercise, you helped Sven run his workspace on FME Flow and saw that it completed successfully. Although the workspace ran successfully, you should know where to access more detailed job information for monitoring, development, and troubleshooting.
For this exercise, follow along with the steps below to view the job log for the job you ran in the previous exercise.
In FME Flow, open Jobs on the left side menu to open completed jobs. Click on the publish-a-workspace-to-fme-flow.fmw job to open the job information.
If you are still on the Run Workspace page, you can click View Details to open the job information alternatively to navigating through the Jobs page.
FME Flow ran the job successfully; however, if it failed, this would be the best place to look for information about what went wrong.
Navigate this page to find information about the job. Expand the Status, Request Data, and Result Data tabs and inspect the job log to answer the following questions:
Remember the answers to these questions - you'll need some of them to complete the quiz!
You've now run a job and inspected it on FME Flow. The job log will be the first place you go to find information and errors about any workspace translations on FME Flow.
